Choosing the right APM (Application Performance Monitoring) tool is crucial for maintaining high-performance applications in complex distributed systems. With commercial solutions like Datadog and New Relic costing thousands monthly, open-source APM tools provide powerful, cost-effective alternatives with transparency, control, and flexibility.
The APM landscape has evolved significantly, with OpenTelemetry becoming the de facto standard for instrumentation (seeing a 43% increase in GitHub commits and 96% enterprise adoption). This shift toward vendor-neutral observability makes open-source APM tools even more attractive, offering comprehensive monitoring capabilities while maintaining full control over observability data.
This guide explores the top 13 open-source APM tools, their strengths, limitations, and ideal use cases to help you make an informed decision.
Why Choose Open Source APM Tools?
Open-source APM tools offer compelling advantages:
- Cost Effectiveness: No licensing fees or per-seat pricing models
- Transparency: Full access to source code for verification and customization
- Data Privacy: Complete control over sensitive performance data
- No Vendor Lock-in: Freedom to migrate between tools and backends
- OpenTelemetry Compatibility: Future-proof instrumentation with industry standards
- Community Innovation: Rapid feature development driven by user needs
APM Tool Categories
Modern APM tools fall into several categories:
Full-Stack Observability Platforms
Tools that integrate metrics, traces, and logs in a unified interface, providing comprehensive visibility across your entire application stack.
Distributed Tracing Specialists
Focused primarily on tracing request flows across microservices to identify latency bottlenecks and performance issues.
Metrics and Monitoring
Specialized in collecting, storing, and alerting on time-series metrics from applications and infrastructure.
Language-Specific APM
Tools optimized for specific programming languages, offering deep code-level insights and performance analysis.
Top 13 Open Source APM Tools
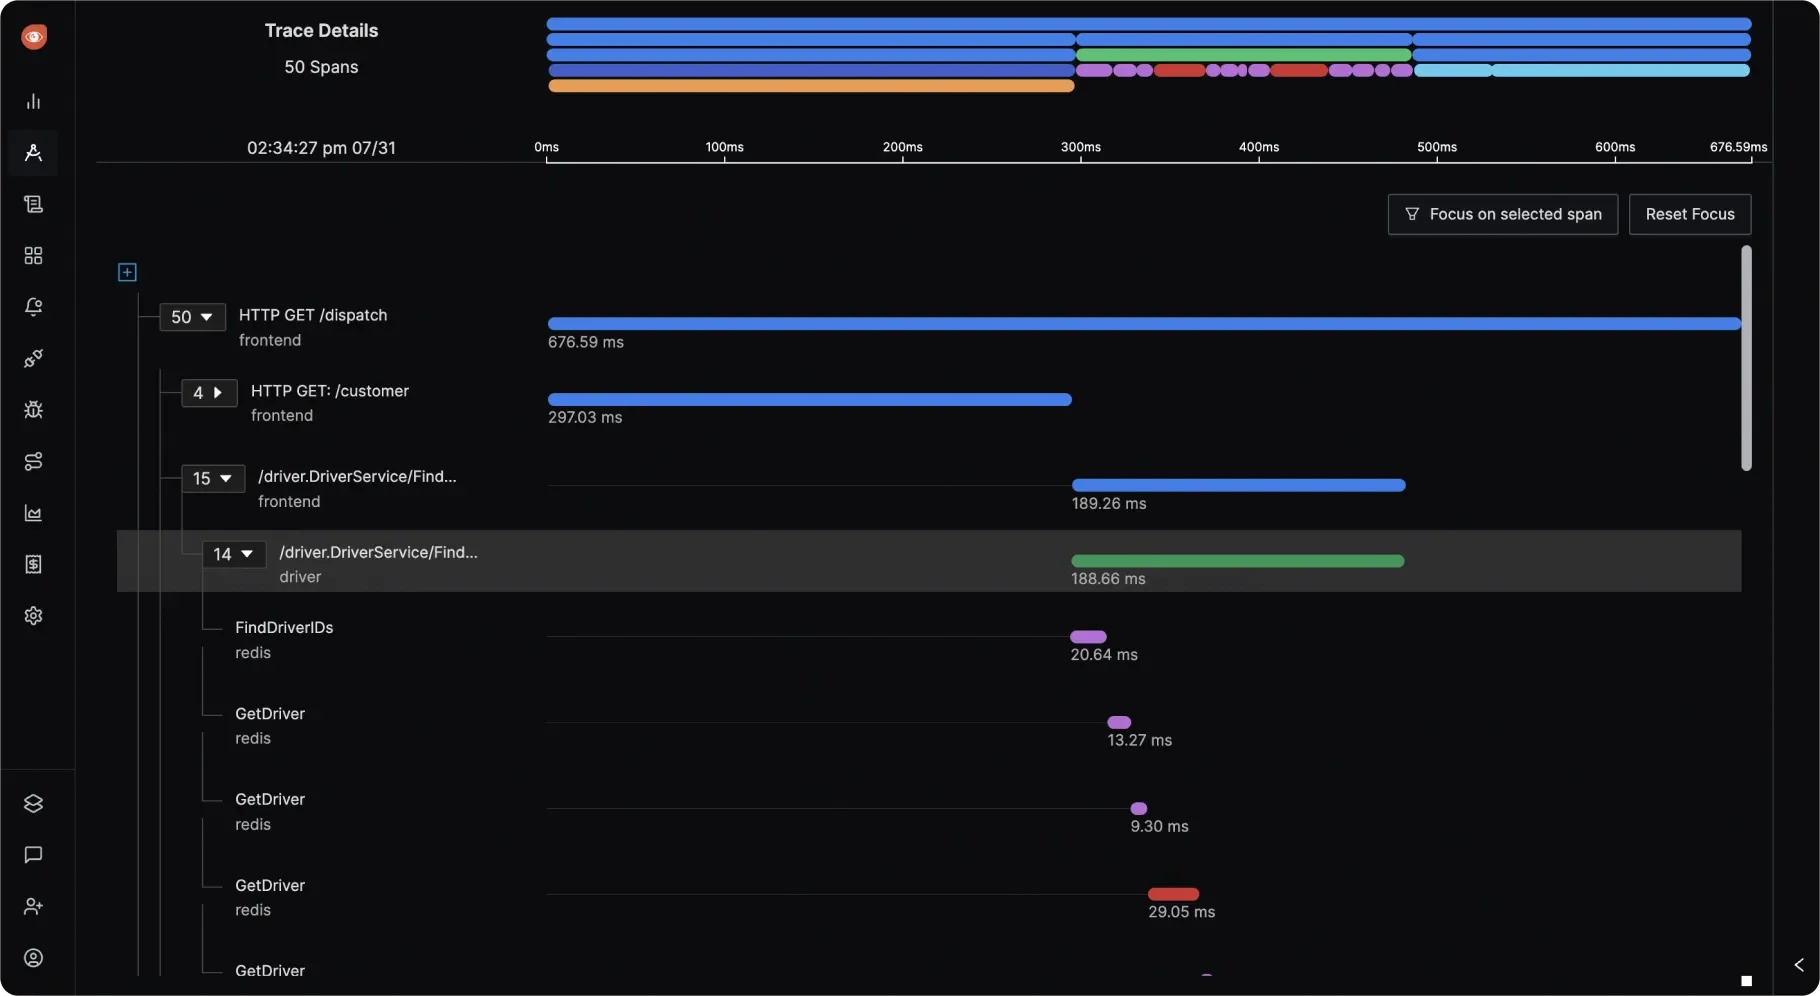
SigNoz
SigNoz is a unified open-source observability platform that combines metrics, traces, logs, and alerts in one interface. Built natively on OpenTelemetry, SigNoz offers both self-hosted and cloud deployment options.
Key Features:
- Unified Observability: Correlates traces, logs, and metrics automatically for comprehensive troubleshooting
- OpenTelemetry Native: Built on OpenTelemetry standards for vendor-neutral instrumentation
- Custom Dashboards: Create tailored visualizations combining all telemetry data types
- Query Builder: User-friendly interface for complex APM queries without learning query languages
- Exception Monitoring: Track and analyze application errors with full context
Pros:
- Single platform eliminates tool fragmentation and reduces operational complexity
- Strong OpenTelemetry integration ensures future compatibility and avoids vendor lock-in
- Self-hosting provides complete data control and privacy
- Active development with regular feature updates
- Cost-effective alternative to commercial APM solutions
Cons:
- Self-hosting requires DevOps expertise for proper deployment and maintenance
- Newer tool with smaller community compared to established projects like Prometheus
Deployment Options:
- Open Source: Free self-hosted community edition
- Cloud: Managed service with 30-day free trial
- Enterprise: Self-hosted with additional features and support
GitHub Stats:
- GitHub stars: 17k+ (rapidly growing)
- Alternative to: Datadog, New Relic, Dynatrace
- SigNoz on GitHub
Best For:
Teams seeking unified observability with OpenTelemetry support, offering flexibility between self-hosted and managed deployment options.
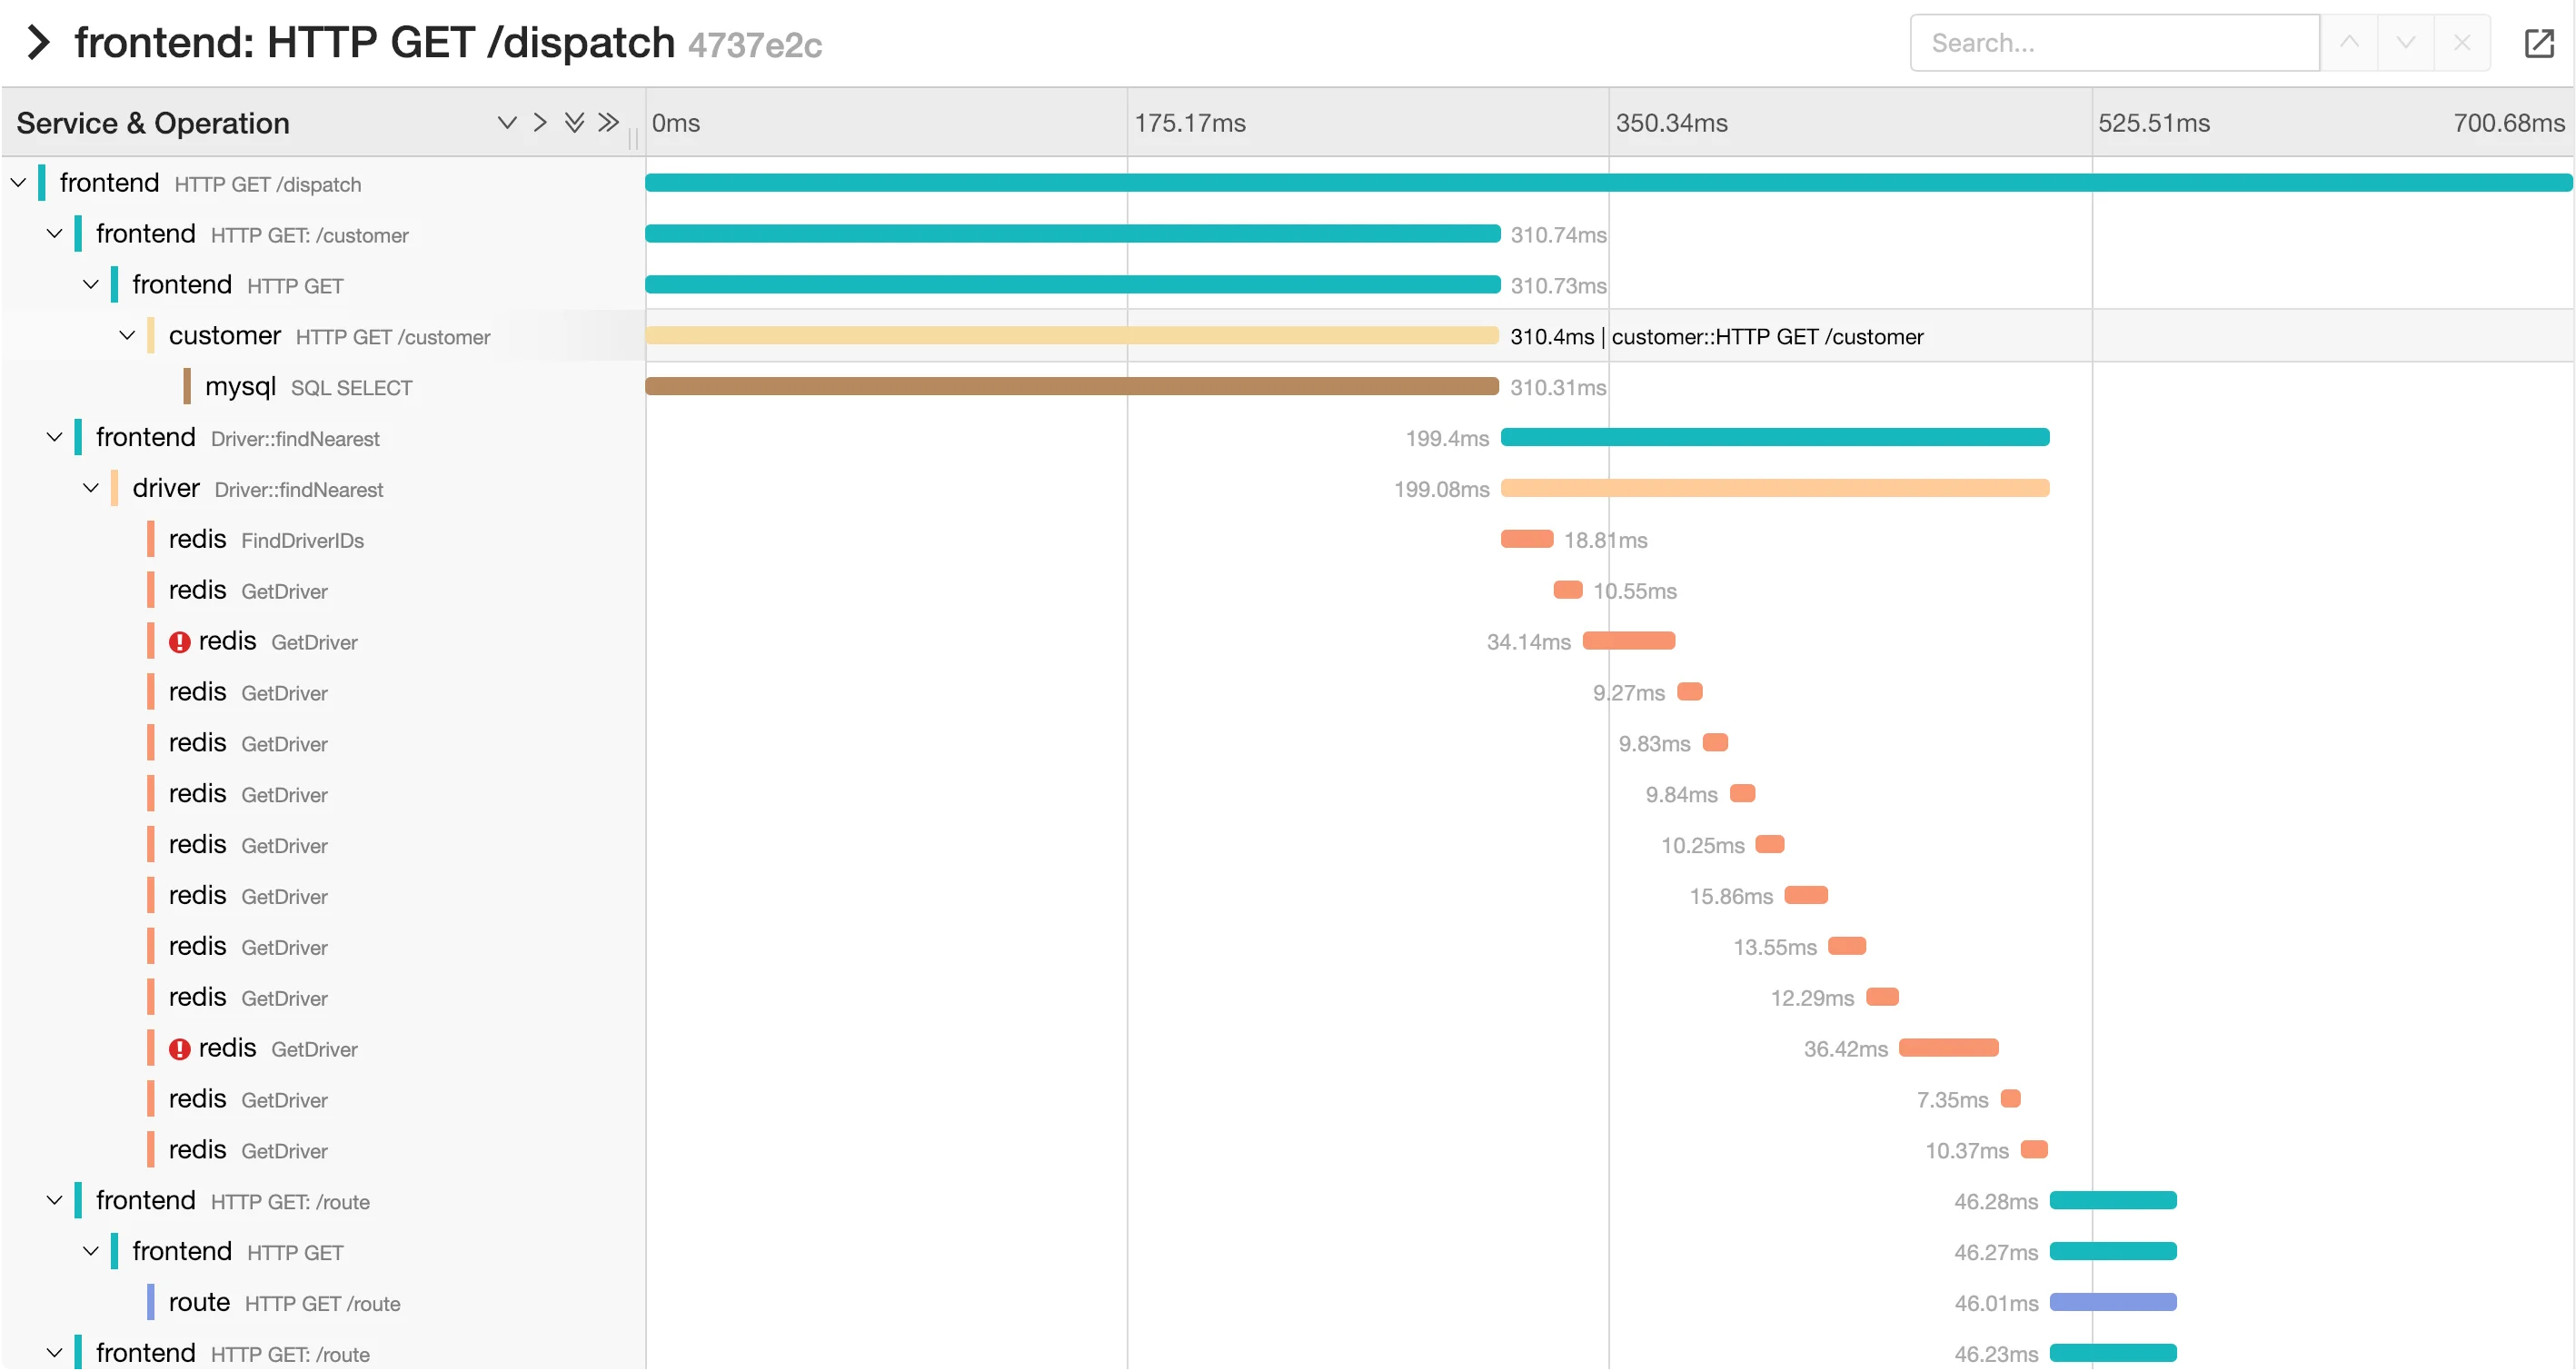
Jaeger
Jaeger is a CNCF-graduated distributed tracing system designed for monitoring and troubleshooting microservices-based distributed systems. Originally developed at Uber, it's become one of the most popular open-source tracing solutions.
Key Features:
- Distributed Context Propagation: Tracks requests across multiple services and systems
- Adaptive Sampling: Intelligent sampling strategies to manage data volume and performance
- Service Dependency Analysis: Visualizes service relationships and communication patterns
- Root Cause Analysis: Identifies performance bottlenecks in complex service interactions
Pros:
- Excellent for understanding transaction flows in microservices architectures
- Mature, stable platform with strong community support
- Integrates seamlessly with OpenTelemetry for data collection
- Supports multiple storage backends (Cassandra, Elasticsearch)
- Advanced sampling strategies reduce performance overhead
Cons:
- Focused primarily on tracing; requires separate tools for metrics and logs
- Complex deployment and configuration, especially at scale
- Storage backend setup can be resource-intensive
Deployment Options:
- Open Source: Free to use and self-host
- Third-party managed: Various cloud providers offer hosted Jaeger services
GitHub Stats:
- GitHub stars: 20k+ (well-established project)
- Alternative to: Zipkin, commercial tracing solutions
- Jaeger on GitHub
Best For:
Teams operating complex microservices architectures who need detailed transaction tracing and latency analysis.
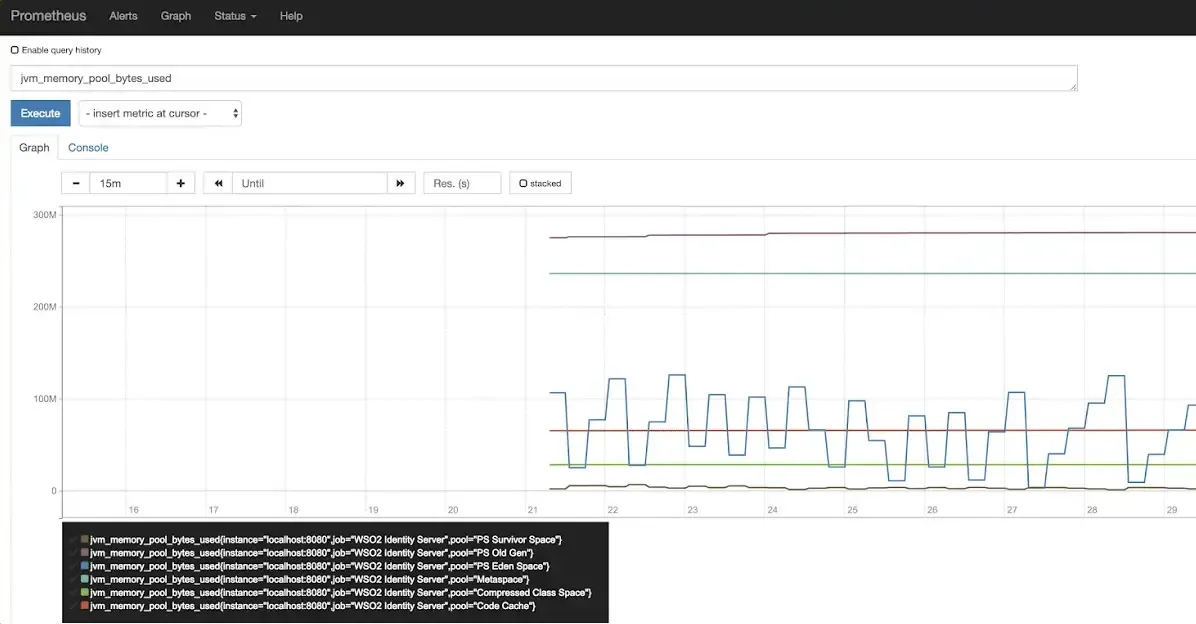
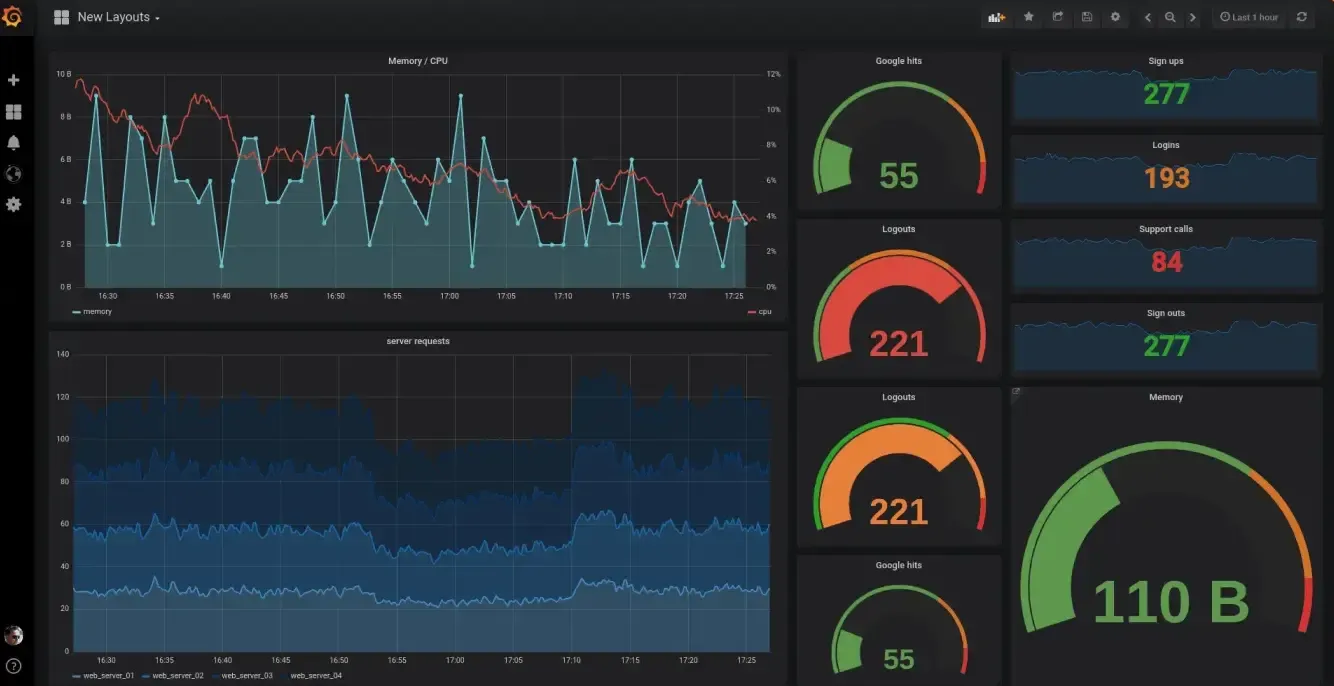
Prometheus + Grafana
Prometheus is a powerful time-series database and monitoring system, commonly paired with Grafana for visualization. This combination has become the de facto standard for metrics monitoring in cloud-native environments.
Key Features:
- PromQL: Powerful query language for flexible data analysis and alerting
- Service Discovery: Automatic target discovery in Kubernetes environments
- Pull-based Architecture: Efficient data collection model with built-in reliability
- Alertmanager: Sophisticated alerting system with notification routing
Pros:
- Industry standard for metrics collection and monitoring
- Excellent Kubernetes integration with native service discovery
- Highly customizable dashboards through Grafana
- Strong ecosystem with numerous exporters and integrations
- Robust alerting capabilities with flexible notification rules
Cons:
- Metrics-only solution; requires additional tools for tracing and logs
- Resource-intensive for high-cardinality metrics
- Requires expertise to properly configure and optimize
- Single-server limitations without additional components (Thanos, Cortex)
Deployment Options:
- Open Source: Free Prometheus and Grafana installations
- Managed Services: Various cloud providers offer hosted Prometheus/Grafana
GitHub Stats:
- Prometheus: 55k+ stars
- Grafana: 60k+ stars
- Prometheus on GitHub
- Grafana on GitHub
Best For:
Teams focused on metrics-driven monitoring and alerting, especially in Kubernetes environments.
Apache SkyWalking
Apache SkyWalking is a comprehensive APM system designed for microservices, cloud-native, and container-based architectures. It offers integrated tracing, metrics, and logging analysis with advanced features like eBPF-based profiling.
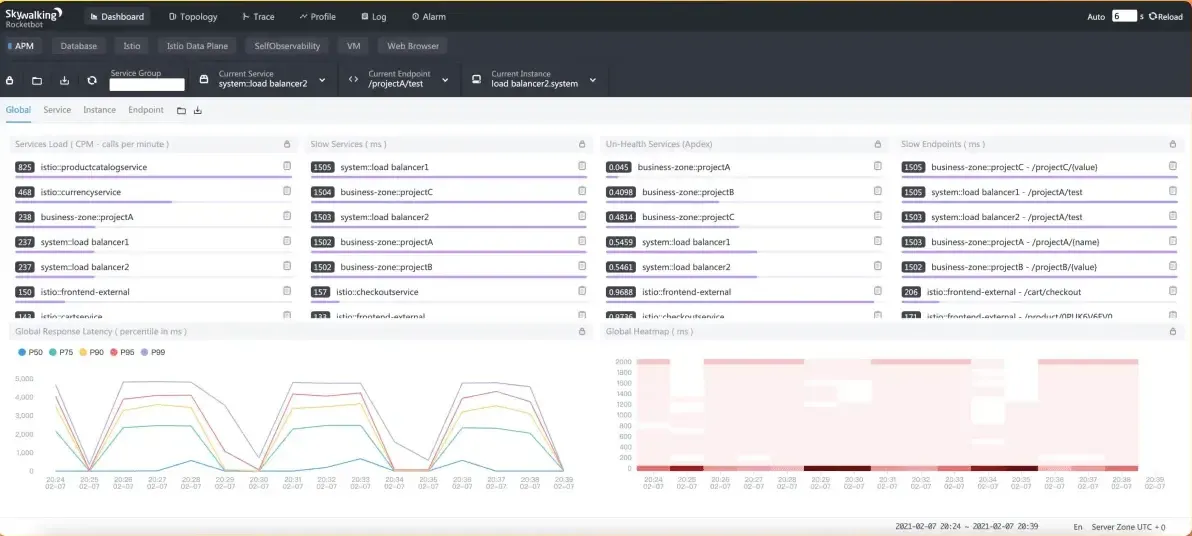
Key Features:
- Service Topology Mapping: Automatically discovers and visualizes service dependencies
- eBPF Profiling: Kernel-level profiling with minimal performance impact
- AI-Powered Anomaly Detection: Machine learning for proactive issue identification
- Multi-Language Support: Agents for Java, .NET, Python, Go, and more
Pros:
- Complete APM solution with integrated observability signals
- Advanced eBPF capabilities for deep system insights
- Excellent for large-scale distributed systems
- Active development with cutting-edge features
- Strong service mesh integration (Istio, Linkerd)
Cons:
- Steeper learning curve compared to simpler tools
- Complex setup and configuration requirements
- Higher resource requirements for full feature utilization
Deployment Options:
- Open Source: Free under Apache 2.0 license
- Third-party managed: Some cloud providers offer hosted SkyWalking
GitHub Stats:
- GitHub stars: 23k+ (highly active project)
- Alternative to: Jaeger, commercial APM solutions
- Apache SkyWalking on GitHub
Best For:
Teams running complex microservices architectures requiring integrated observability with advanced profiling capabilities.
Elastic APM
Elastic APM is the application performance monitoring component of the Elastic Stack (ELK), providing seamless integration with Elasticsearch and Kibana for centralized observability.
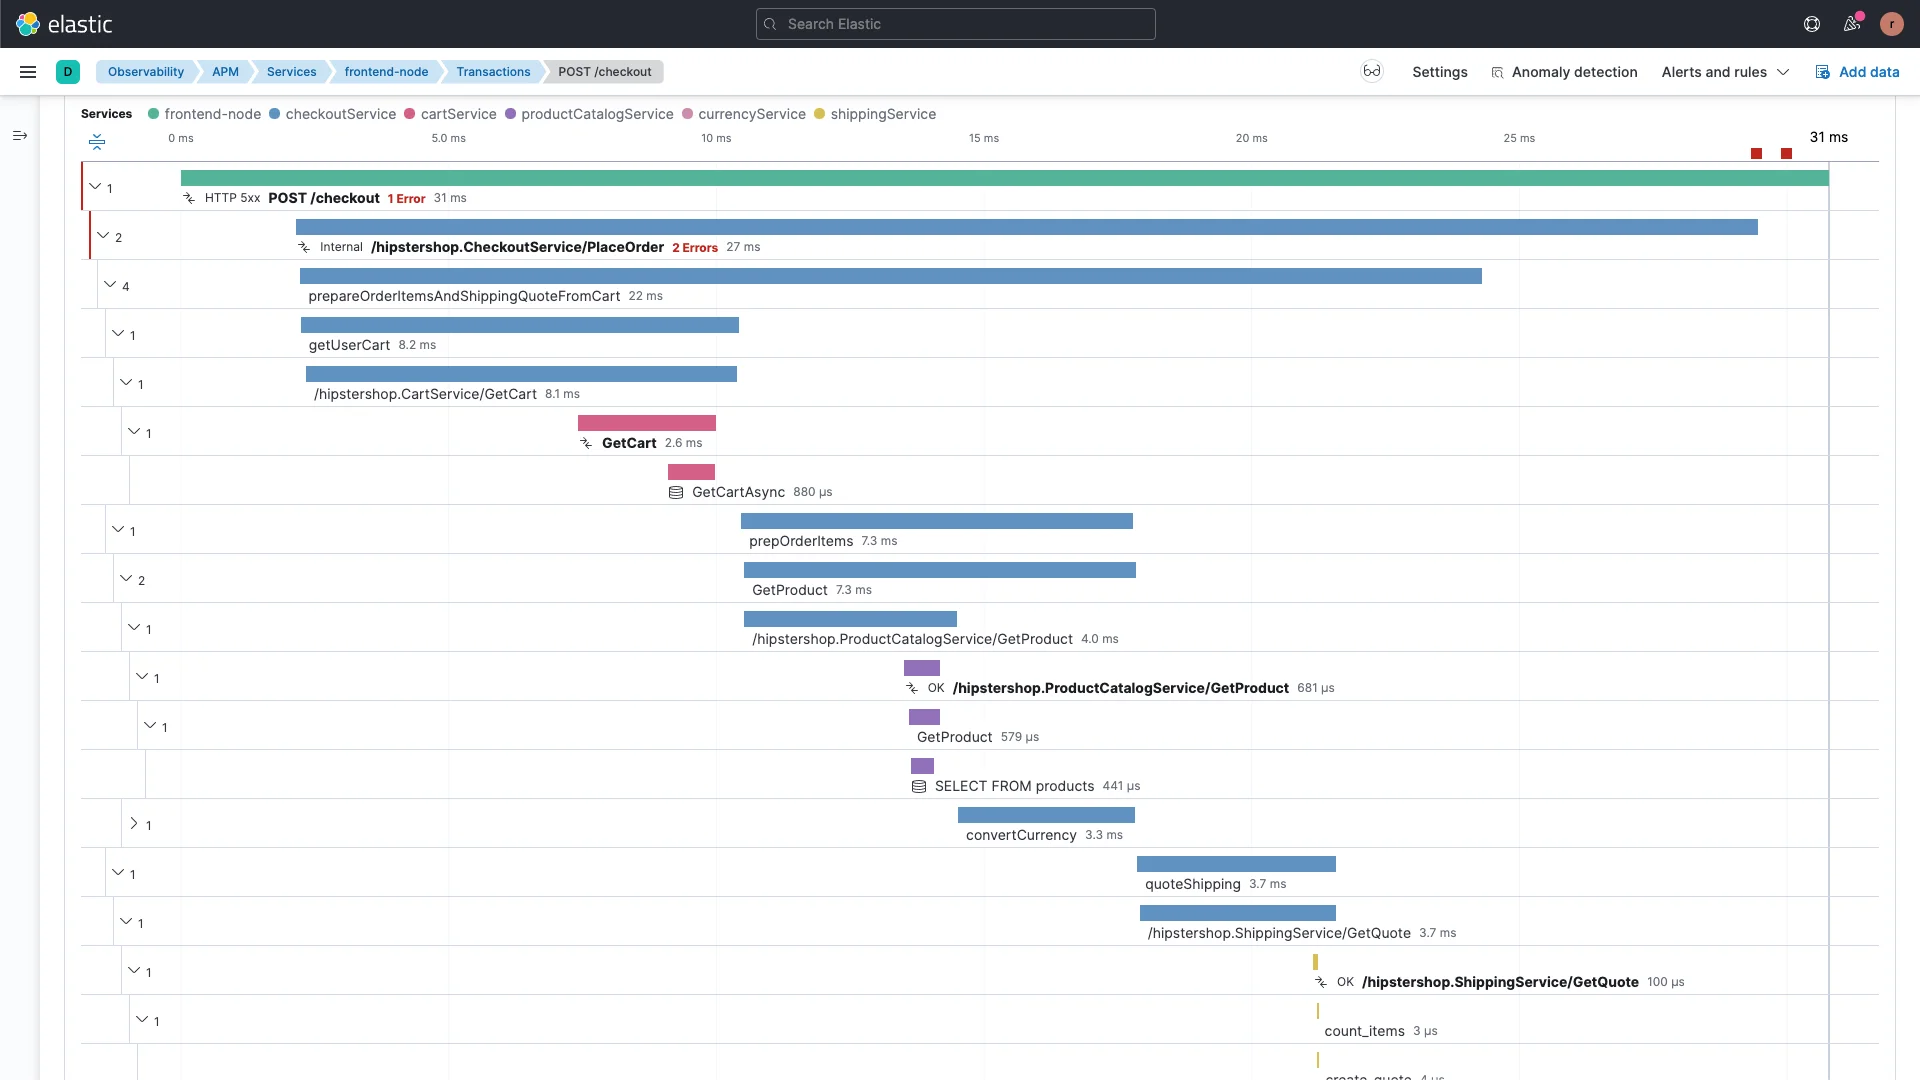
Key Features:
- Elastic Stack Integration: Unified platform for logs, metrics, and traces
- Real User Monitoring (RUM): Browser-side performance monitoring
- Machine Learning: Anomaly detection and alerting powered by Elasticsearch ML
- Code Profiling: CPU and memory profiling for performance optimization
Pros:
- Seamless integration with existing Elastic Stack deployments
- Powerful search and analytics capabilities through Elasticsearch
- Comprehensive observability when combined with Filebeat and Metricbeat
- Strong visualization capabilities in Kibana
Cons:
- Requires familiarity with Elastic Stack ecosystem
- Resource-intensive, especially for high-volume environments
- Commercial features require paid subscriptions
- APM capabilities may be less specialized than dedicated tools
Deployment Options:
- Open Source: Basic APM features available in open-source Elastic Stack
- Elastic Cloud: Managed service with enhanced features
GitHub Stats:
- GitHub stars: 3.7k (APM server repository)
- Alternative to: Datadog APM, New Relic
- Elastic APM on GitHub
Best For:
Organizations already invested in the Elastic Stack ecosystem seeking integrated APM capabilities.
Zipkin
Zipkin is one of the original open-source distributed tracing systems, known for its simplicity and effectiveness in visualizing latency in distributed systems.
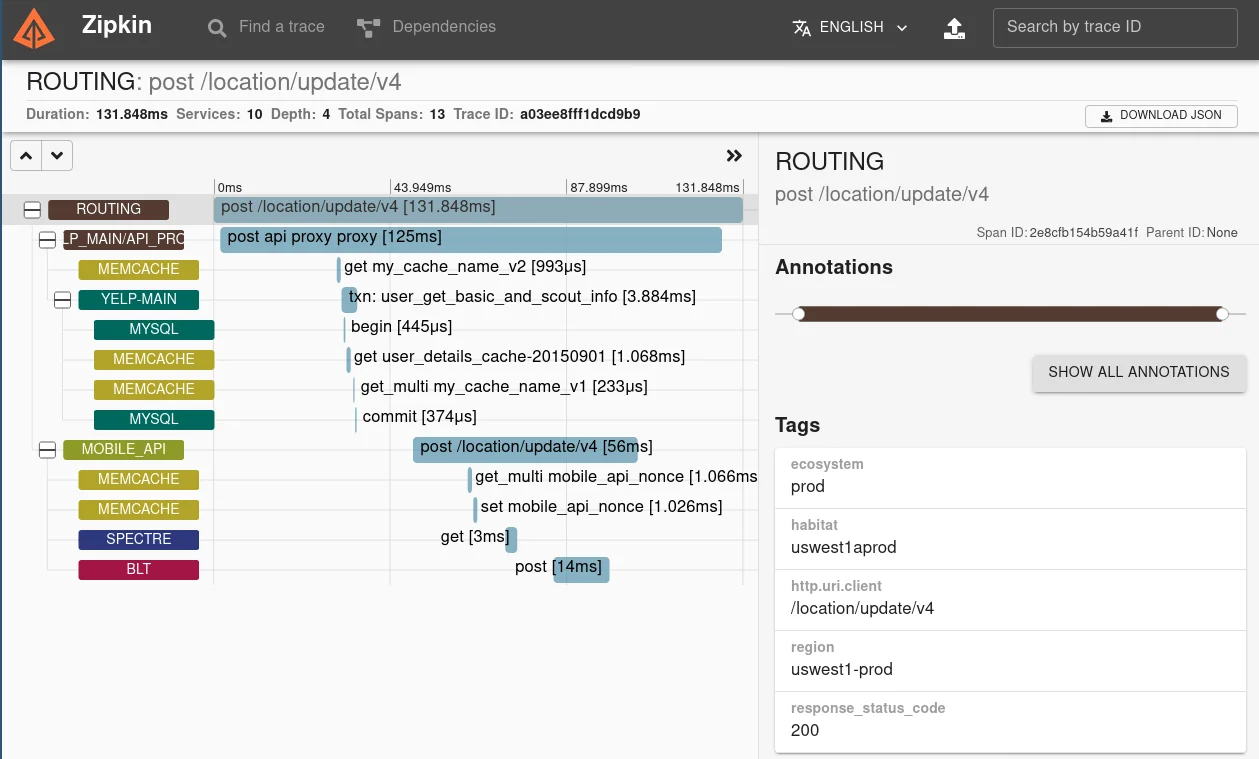
Key Features:
- Simple Architecture: Single-server setup simplifies deployment
- HTTP Tracing: Excellent visibility into HTTP request/response cycles
- Storage Flexibility: Supports multiple backends (Cassandra, Elasticsearch, MySQL)
- OpenTelemetry Compatibility: Works with OpenTelemetry exporters
Pros:
- Easy to set up and deploy compared to more complex tracing systems
- Lightweight with minimal operational overhead
- Good integration with Spring Boot applications via Spring Cloud Sleuth
- Stable, mature codebase with proven reliability
Cons:
- Limited UI capabilities compared to modern tracing tools
- Focused solely on tracing; no metrics or logs functionality
- Scalability challenges in high-throughput environments
- Fewer advanced features compared to newer tracing platforms
Deployment Options:
- Open Source: Free to use and self-host
GitHub Stats:
- GitHub stars: 17k+ stars
- Alternative to: Jaeger, commercial tracing solutions
- Zipkin on GitHub
Best For:
Teams needing simple distributed tracing, especially in Java/Spring Boot environments.
Pinpoint
Pinpoint is an open-source APM tool focused on providing deep performance analysis for Java and PHP applications with code-level visibility and real-time monitoring.
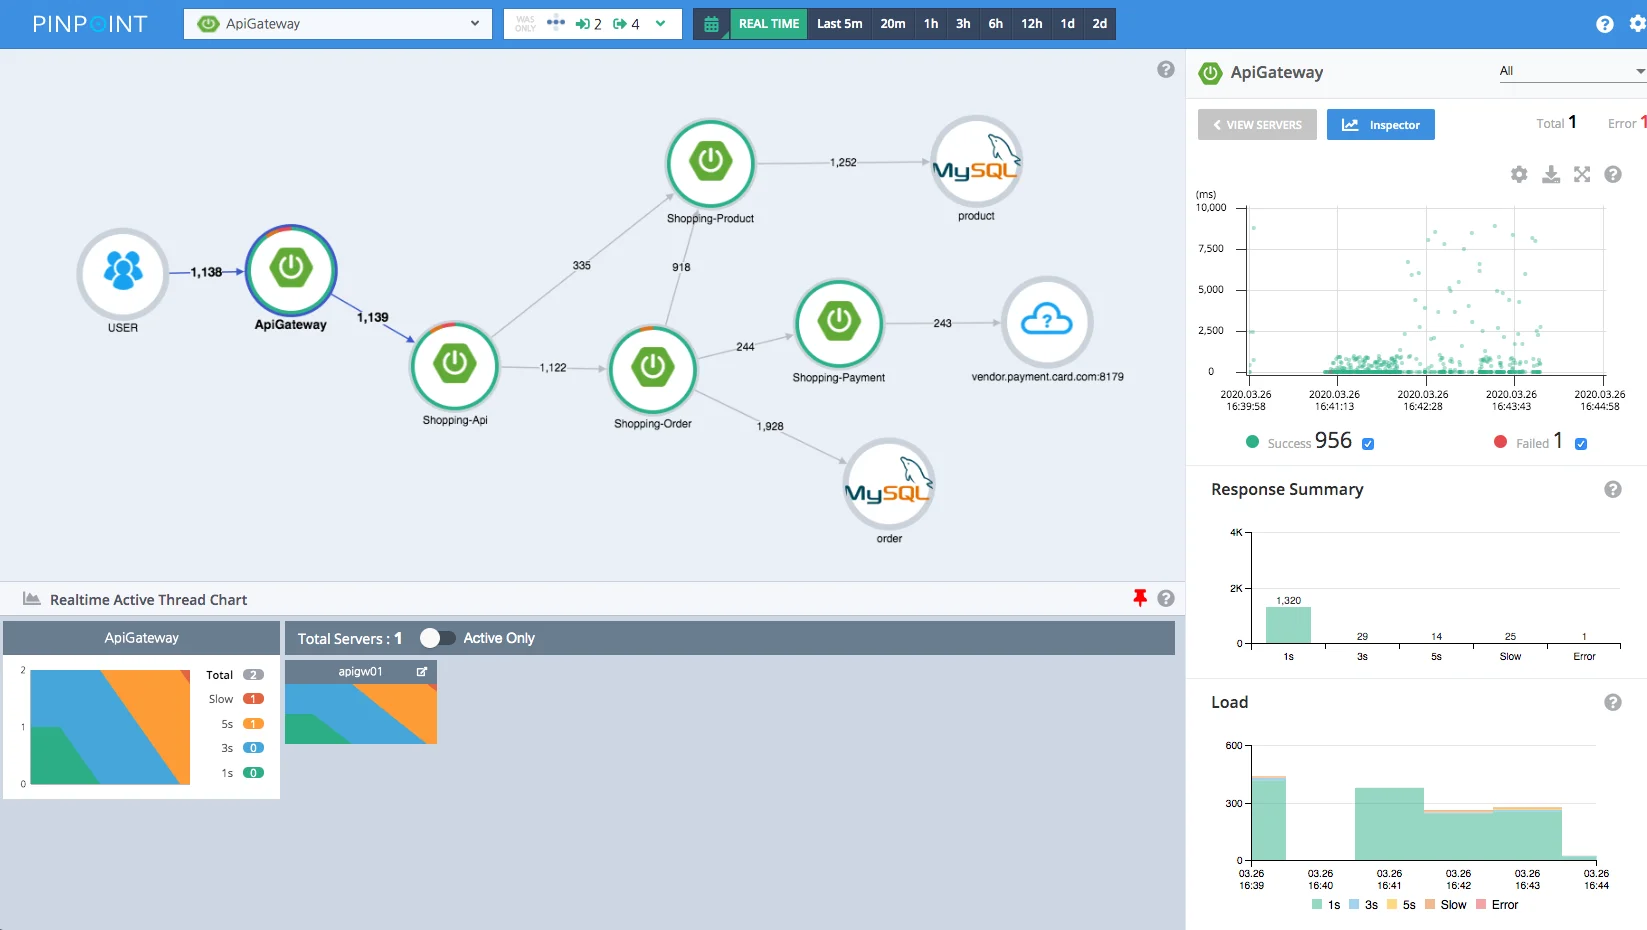
Key Features:
- Bytecode Instrumentation: Deep code-level insights through automated instrumentation
- Real-time Monitoring: Live performance metrics and transaction tracking
- Call Stack Analysis: Detailed method-level performance profiling
- Thread Monitoring: Track thread usage and potential deadlocks
Pros:
- Extremely detailed code-level performance insights
- Low overhead (~3%) through efficient instrumentation
- Real-time monitoring capabilities for immediate issue detection
- Active development with regular updates
Cons:
- Limited to Java and PHP environments
- Complex setup and configuration process
- Visualization tied to Pinpoint UI (less flexibility than generic dashboards)
- Smaller community compared to broader APM tools
Deployment Options:
- Open Source: Free to use and self-host
GitHub Stats:
- GitHub stars: 13.5k+ stars
- Alternative to: New Relic, AppDynamics for Java/PHP
- Pinpoint on GitHub
Best For:
Teams primarily running Java and PHP applications needing deep code-level performance analysis.
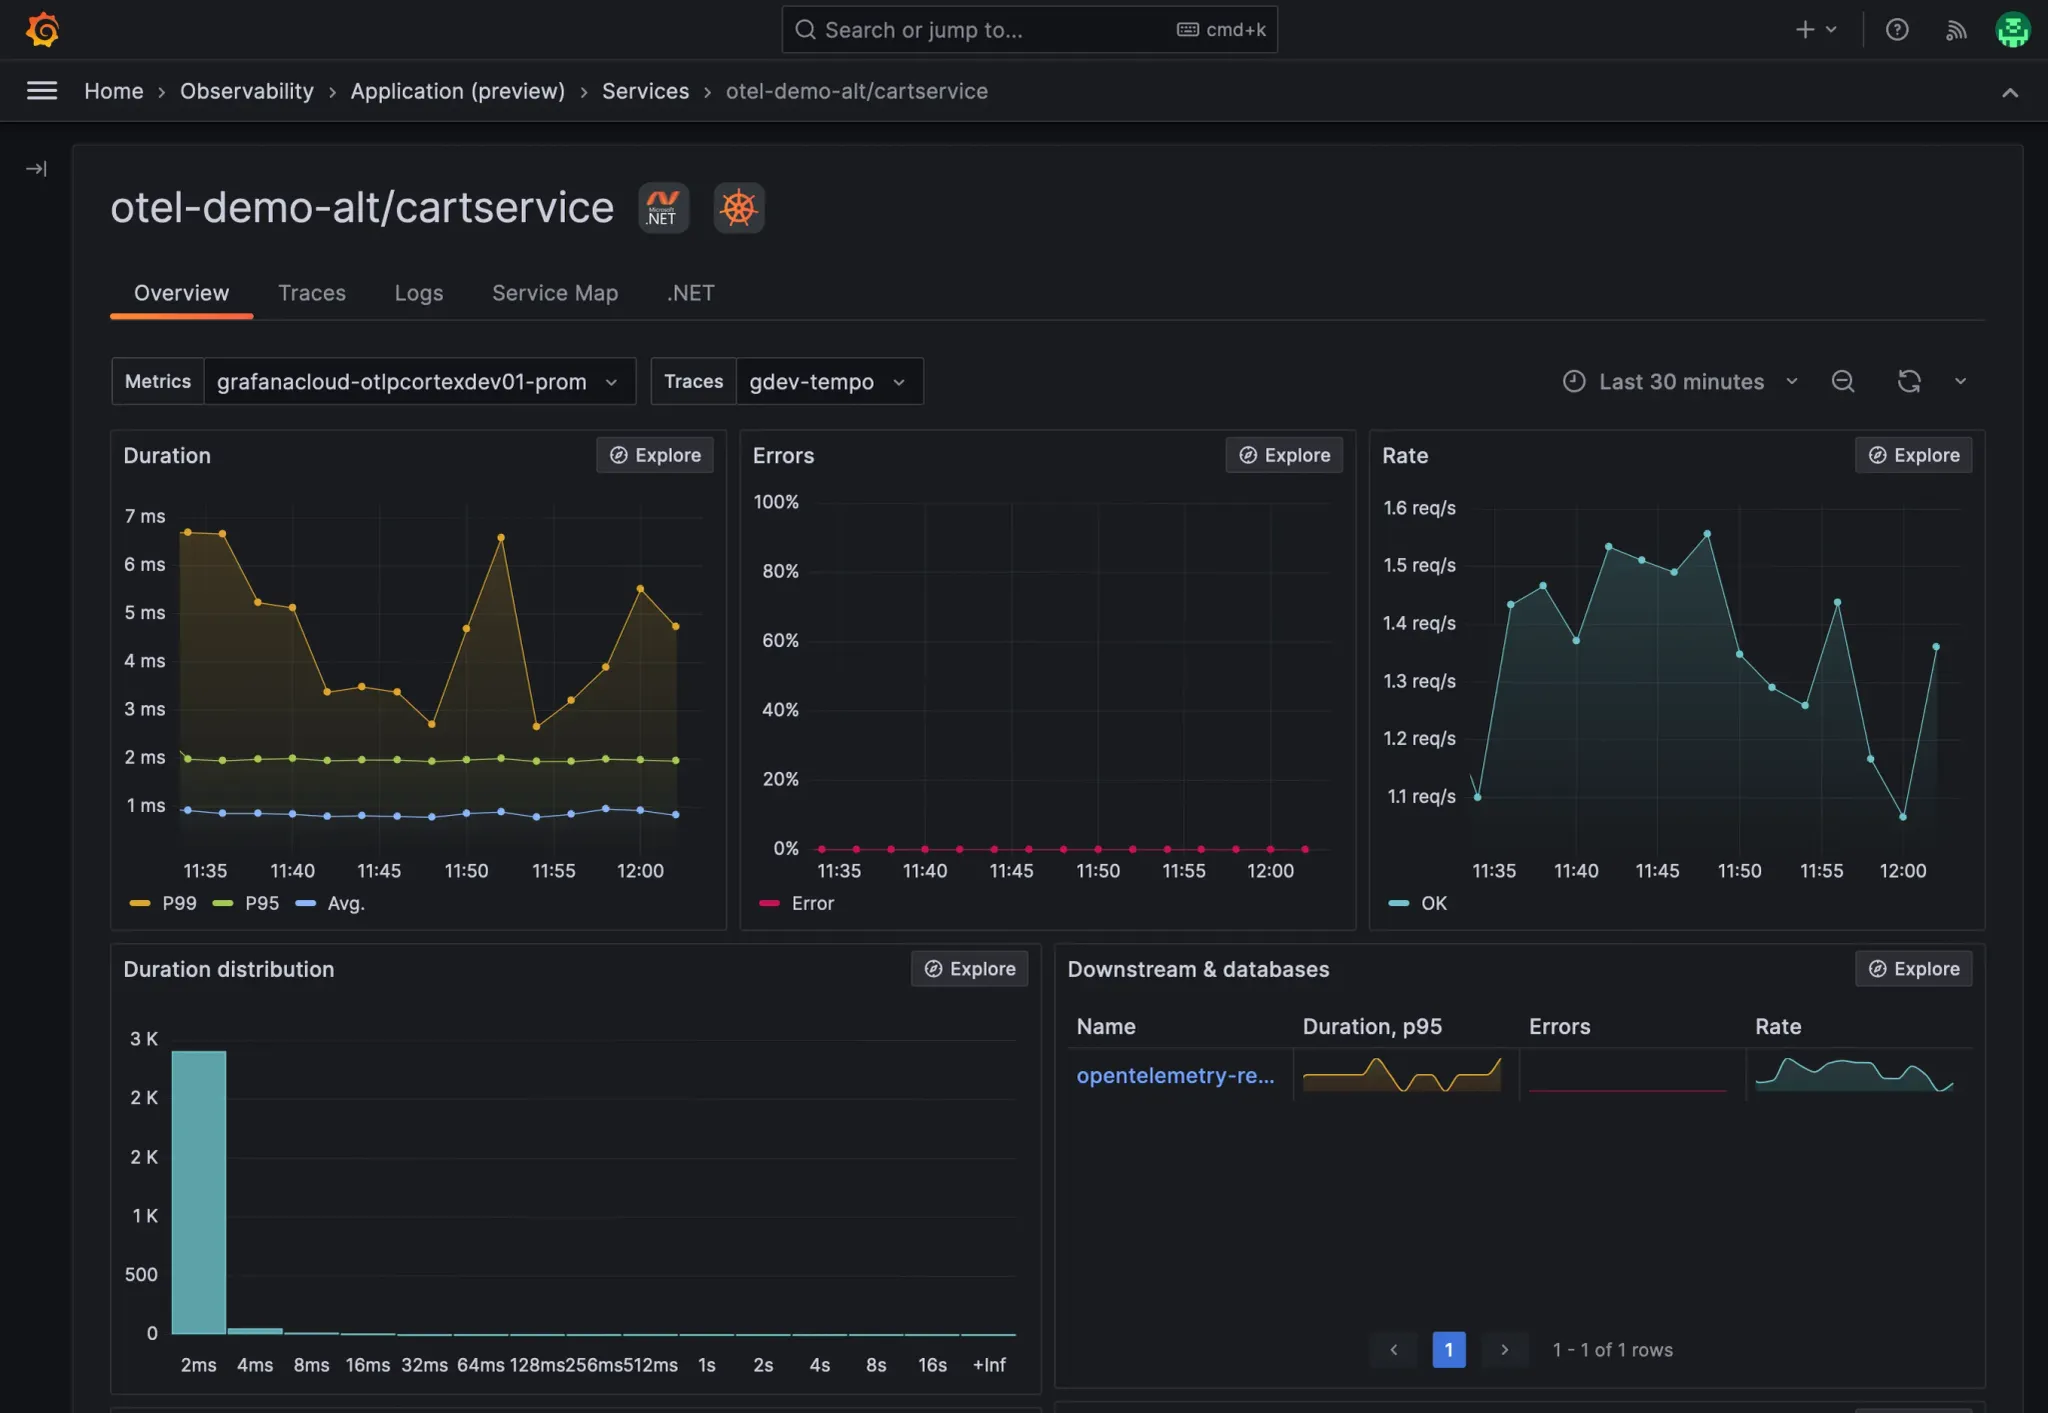
Grafana LGTM Stack
Grafana's observability platform built on the LGTM stack (Loki for logs, Grafana for visualization, Tempo for traces, and Mimir for metrics) provides a comprehensive open-source observability solution.
Key Features:
- Loki: Cost-efficient log aggregation and querying
- Tempo: Scalable distributed tracing backend
- Mimir: Long-term metrics storage with high availability
- Enhanced OpenTelemetry Support: Native OTLP integration and metric support
Pros:
- Unified observability platform with single-pane-of-glass visibility
- Highly flexible and customizable dashboards
- Excellent integration with diverse data sources
- Strong OpenTelemetry support added in 2025
- Active development with regular feature improvements
Cons:
- Complex setup requiring management of multiple components
- Requires significant expertise to configure and optimize properly
- Resource-intensive when running the full stack
Deployment Options:
- Open Source: Free self-hosted LGTM stack components
- Grafana Cloud: Managed service with integrated LGTM stack
GitHub Stats:
- Combined: 60k+ stars across LGTM components
- Alternative to: Datadog, New Relic platforms
- Grafana repositories
Best For:
Teams needing powerful, customizable observability with flexibility to integrate various data sources.
Graphite
Graphite is a simple, scalable solution for storing and visualizing time-series metrics data, often used as a lightweight alternative to more complex monitoring systems.
Key Features:
- Carbon: Service for receiving time-series data
- Whisper: Database for storing time-series data efficiently
- Graphite-web: Web interface and API for rendering graphs
Pros:
- Simple architecture and straightforward setup
- Scalable for handling large volumes of time-series data
- Integrates well with Grafana and other visualization tools
- Minimal resource requirements compared to feature-rich alternatives
Cons:
- Limited to metrics collection only
- Basic visualization capabilities without additional tools
- No built-in alerting (requires external systems)
- Less actively developed compared to modern alternatives
Deployment Options:
- Open Source: Free to use and self-host
- Hosted services: Available through various providers
GitHub Stats:
- GitHub stars: 5.9k+ stars
- Alternative to: InfluxDB, basic Prometheus setups
- Graphite on GitHub
Best For:
Teams needing simple metrics storage and graphing, often as part of a larger monitoring ecosystem.
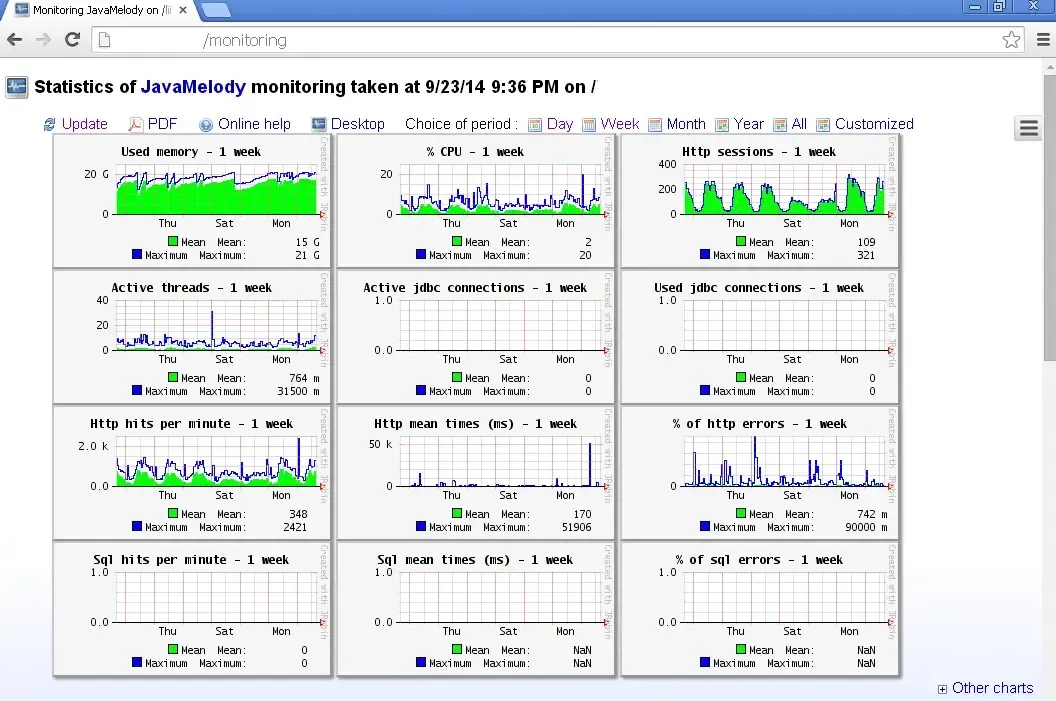
JavaMelody
JavaMelody is a lightweight monitoring tool that embeds directly into Java web applications, providing real-time performance insights with minimal setup.
Key Features:
- Embedded Monitoring: Integrates directly as a JAR file in Java applications
- JVM Metrics: Comprehensive Java Virtual Machine performance monitoring
- SQL Query Analysis: Database query performance tracking and optimization
- HTTP Session Monitoring: User session tracking and analysis
Pros:
- Extremely simple integration (just add JAR to classpath)
- No external infrastructure required
- Real-time monitoring directly within applications
- Minimal performance overhead
Cons:
- Limited to Java web applications only
- Basic visualization compared to dedicated dashboarding tools
- No distributed tracing capabilities
- Embedded UI may not suit all deployment scenarios
Deployment Options:
- Open Source: Free to embed in Java applications
GitHub Stats:
- GitHub stars: 2.9k+ stars
- Alternative to: Basic APM for Java applications
- JavaMelody on GitHub
Best For:
Java development teams needing simple, zero-infrastructure application monitoring.
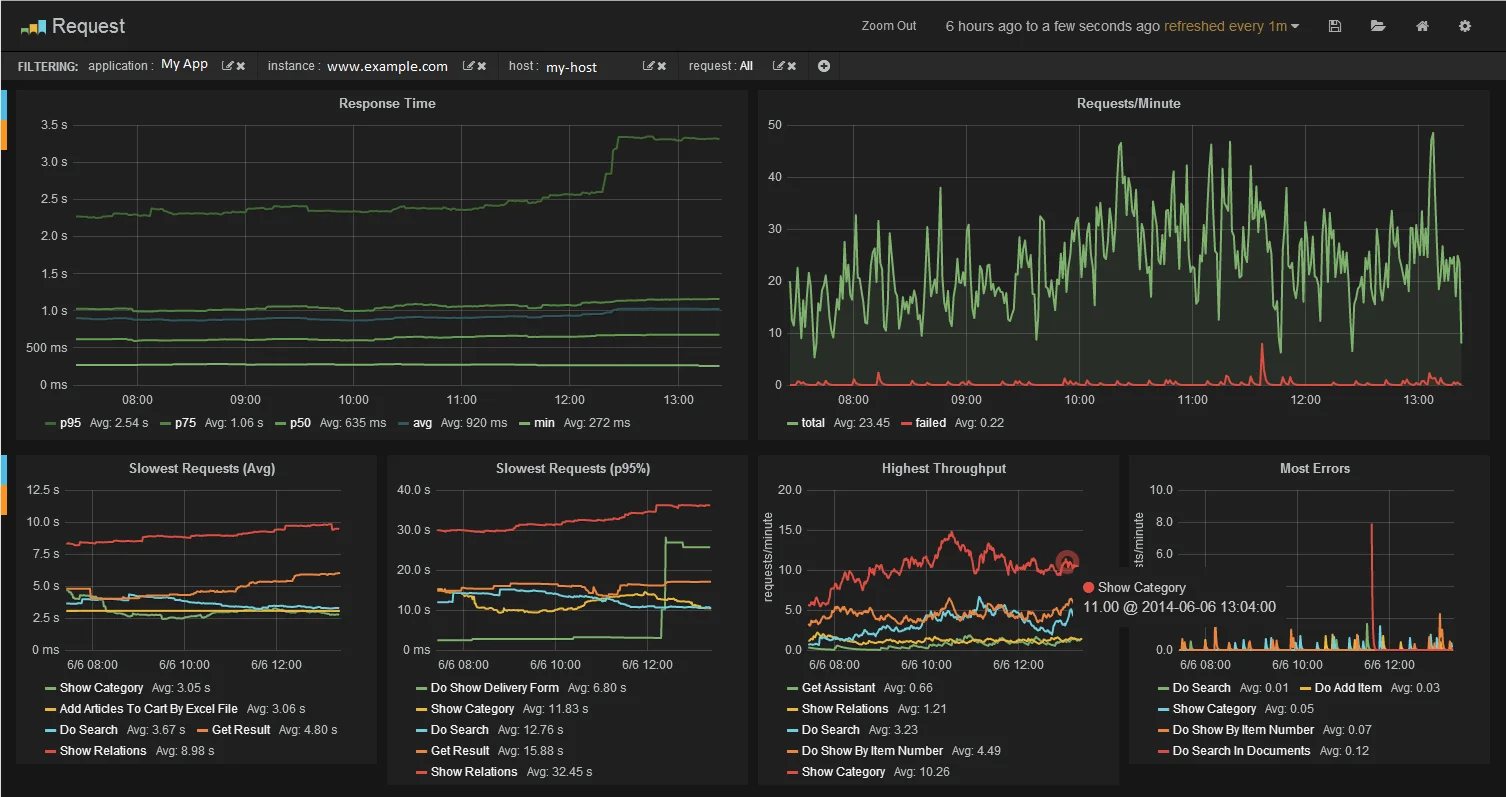
Stagemonitor
Stagemonitor provides detailed performance monitoring and analysis designed for Java web applications in production environments.
Key Features:
- Request Processing Analysis: Detailed breakdown of request handling performance
- SQL Monitoring: Database query performance tracking and optimization suggestions
- Exception Tracking: Comprehensive error monitoring with stack traces
- Call Stack Profiling: Method-level performance profiling
Pros:
- Detailed performance insights for Java web applications
- Built-in profiling capabilities for performance optimization
- Good integration with servlet-based applications
- Active maintenance and updates
Cons:
- Java-specific solution with limited language support
- More complex setup compared to simpler monitoring tools
- Built-in visualization may not match dedicated dashboarding platforms
Deployment Options:
- Open Source: Free to use and configure
GitHub Stats:
- GitHub stars: 1.7k+ stars
- Alternative to: Commercial Java APM solutions
- Stagemonitor on GitHub
Best For:
Java web application teams needing detailed performance analysis and optimization insights.
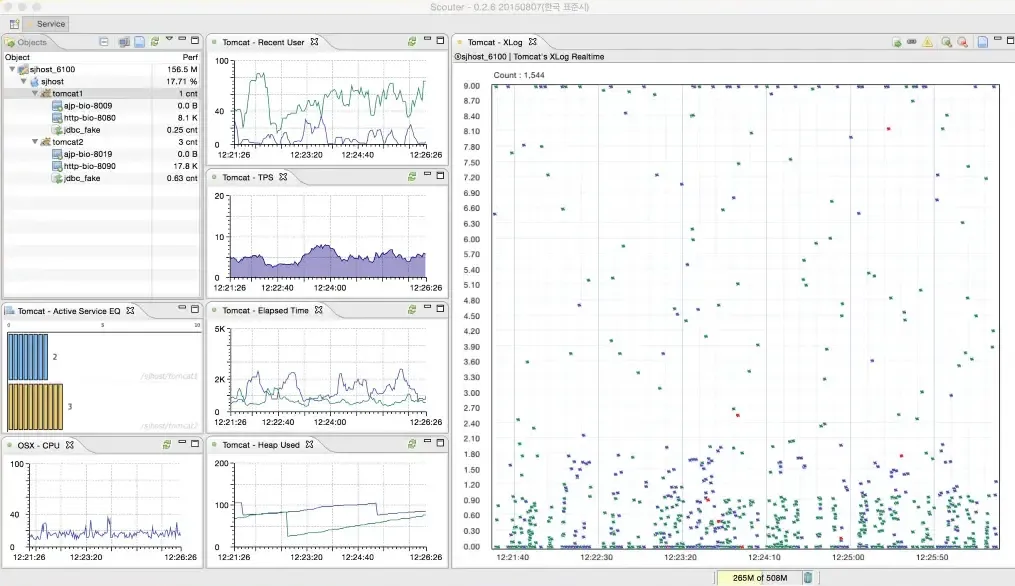
Scouter
Scouter is an open-source APM tool focused on real-time monitoring and historical analysis primarily for Java applications, with support for additional system components.
Key Features:
- Real-time Metrics: Live monitoring of CPU, memory, and network performance
- Historical Analysis: Long-term trend analysis and performance tracking
- Database Monitoring: Support for MySQL, Oracle, and other database systems
- Zipkin Integration: Recent addition of distributed tracing capabilities
Pros:
- Comprehensive real-time and historical monitoring
- Supports both application and infrastructure monitoring
- Active development with new features like Zipkin support
- Good for Java-centric environments
Cons:
- Primarily Java-focused with limited multi-language support
- UI may feel less modern compared to contemporary tools
- Smaller community and ecosystem compared to major APM platforms
Deployment Options:
- Open Source: Free to use and self-host
GitHub Stats:
- GitHub stars: 2.6k+ stars
- Alternative to: Traditional Java monitoring solutions
- Scouter on GitHub
Best For:
Teams running Java applications who need combined application and infrastructure monitoring.
App Metrics
App Metrics is a comprehensive .NET library for collecting and reporting application metrics, designed to instrument .NET applications with minimal effort.
Key Features:
- Metric Types: Support for counters, gauges, histograms, meters, and timers
- Flexible Reporting: Multiple output formats and destinations (Prometheus, InfluxDB, Graphite)
- ASP.NET Core Integration: Built-in middleware for web application monitoring
- OpenTelemetry Compatibility: Works with modern .NET monitoring ecosystem
Pros:
- Easy integration into .NET applications and frameworks
- Flexible metric collection with various metric types
- Multiple export options for different backend systems
- Active integration with modern .NET monitoring features
Cons:
- Metrics-only library (not a complete APM solution)
- Requires separate visualization and alerting tools
- .NET-specific (not suitable for polyglot environments)
Deployment Options:
- Open Source: Free library for .NET applications
GitHub Stats:
- GitHub stars: 2.2k+ stars
- Alternative to: Application Insights for .NET metrics
- App Metrics on GitHub
Best For:
.NET development teams seeking flexible metrics instrumentation for their applications.
How to Choose the Right Open Source APM Tool
Selecting the appropriate open-source APM tool requires careful consideration of multiple factors:
Assess Your Observability Needs
Full-Stack Observability: If you need metrics, traces, and logs in one platform, consider SigNoz, Apache SkyWalking, or the Grafana LGTM stack.
Specialized Requirements: For metrics-only monitoring, Prometheus + Grafana excels. For distributed tracing specifically, Jaeger or Zipkin are excellent choices.
Evaluate Technical Requirements
- Architecture Type: Microservices benefit from distributed tracing (Jaeger, SkyWalking), while monoliths may need deep application profiling (Pinpoint, JavaMelody)
- Programming Languages: Consider language-specific tools (JavaMelody for Java, App Metrics for .NET) vs. multi-language platforms
- Performance Overhead Tolerance: Tools like Pinpoint offer deep insights but may impact performance more than lighter solutions
Consider Operational Complexity
- Simple Setup: Zipkin and JavaMelody require minimal configuration
- Moderate Complexity: Prometheus + Grafana offers good balance of features and setup complexity
- High Complexity: SkyWalking and the full LGTM stack require significant expertise but provide comprehensive capabilities
Evaluate Community and Development Health
Before choosing any tool, verify:
- Recent commits: Active development indicates ongoing support and bug fixes
- Maintainer responsiveness: Check issue response times and community support
- OpenTelemetry support: Future-proof your investment with vendor-neutral instrumentation
- Documentation quality: Comprehensive guides reduce implementation time
Plan for Scale and Performance
Performance Benchmark Considerations (based on 2025 data):
- Jaeger: 15-30% throughput impact, mitigated by adaptive sampling
- Zipkin: 10-25% throughput impact, simpler but less scalable
- OpenTelemetry: 5-20% impact when properly configured
- SkyWalking: 5-15% impact, eBPF reduces overhead further
Recommended Tool Combinations by Use Case
For Startups and Small Teams
Recommendation: SigNoz or Zipkin + Prometheus + Grafana
- Rationale: Balance of simplicity and functionality without overwhelming complexity
For Large-Scale Microservices
Recommendation: OpenTelemetry + Jaeger + Prometheus + Grafana
- Rationale: Industry-standard stack with proven scalability and vendor neutrality
For Java-Heavy Environments
Recommendation: Pinpoint or JavaMelody (for simpler needs)
- Rationale: Deep Java-specific insights and optimizations
For Full-Stack Observability
Recommendation: SigNoz or Apache SkyWalking
- Rationale: Unified platforms reduce tool fragmentation and operational overhead
For Existing Elastic Stack Users
Recommendation: Elastic APM
- Rationale: Leverages existing infrastructure and expertise
Emerging Trends in Open Source APM
The open-source APM landscape continues evolving rapidly:
- OpenTelemetry Standardization: 96% enterprise adoption making it the universal instrumentation standard
- eBPF Integration: Tools like SkyWalking leading with kernel-level profiling capabilities
- AI-Powered Analysis: Machine learning for anomaly detection and root cause analysis
- Cloud-Native Focus: Enhanced Kubernetes and service mesh integrations
- Cost Optimization: Intelligent sampling and data management to reduce storage costs
Get Started with SigNoz
SigNoz offers a comprehensive APM solution that combines the best aspects of multiple tools in a single platform. With native OpenTelemetry support, automatic correlation of traces, logs, and metrics, and flexible deployment options, SigNoz simplifies observability while providing enterprise-grade capabilities.
Key APM features include:
- Distributed Tracing: End-to-end request tracking across microservices with detailed latency analysis
- Custom Metrics Dashboards: Build tailored visualizations combining different telemetry data types
- Log Management: Centralized log aggregation with trace correlation for faster troubleshooting
- Exception Monitoring: Track application errors with full context including related traces and logs
- Alert Management: Smart alerting based on metrics, traces, or log patterns
You can choose between various deployment options in SigNoz. The easiest way to get started with SigNoz is SigNoz cloud. We offer a 30-day free trial account with access to all features.
Those who have data privacy concerns and can't send their data outside their infrastructure can sign up for either enterprise self-hosted or BYOC offering.
Those who have the expertise to manage SigNoz themselves or just want to start with a free self-hosted option can use our community edition.
The open-source APM landscape offers powerful alternatives to expensive commercial solutions, with tools like SigNoz leading toward unified observability platforms. While tool fragmentation remains a challenge, OpenTelemetry adoption as an industry standard is creating more interoperable and flexible monitoring solutions.
Whether you choose a specialized tool like Jaeger for distributed tracing, the proven Prometheus + Grafana combination for metrics, or a comprehensive platform like SigNoz for full-stack observability, the key is selecting tools that match your technical requirements, team expertise, and long-term scalability needs.
The future of APM lies in unified platforms that reduce operational complexity while maintaining the flexibility and cost advantages that make open-source tools attractive. With proper planning and implementation, open-source APM tools provide enterprise-grade monitoring capabilities at a fraction of commercial alternatives' cost.
Further Reading
Kubernetes Monitoring Tools
New Relic Alternatives
Log Monitoring
Hope we answered all your questions regarding open source APM tools. If you have more questions, feel free to join and ask on our slack community.
You can also subscribe to our newsletter for insights from observability nerds at SigNoz — get open source, OpenTelemetry, and devtool-building stories straight to your inbox.
